Simplifying Service Discovery in Prometheus and Integrating with Grafana for Real-time Monitoring
Introduction to Service Discovery in Prometheus
In today's fast-paced and dynamic IT environments, it’s essential to monitor infrastructure and applications in real-time. Whether you’re dealing with a microservices architecture or running on a cloud platform, the number of services and their instances can change frequently. To address this, service discovery plays a crucial role, enabling systems to automatically detect and monitor new services or resources without manual intervention. In Prometheus, service discovery automates the process of finding and scraping targets for metrics collection, which is critical for scaling your monitoring infrastructure.

Why Service Discovery is Crucial
In modern environments where services are constantly being added, removed, or relocated, manually updating monitoring configurations for each change can quickly become unmanageable. This is where service discovery comes into play, ensuring that Prometheus can detect new services and dynamically update its target list to reflect changes in the infrastructure. With service discovery, monitoring becomes automated, scalable, and adaptable to evolving environments.
Key Benefits of Service Discovery
Automation: Prometheus automatically detects and configures new services without manual intervention, making monitoring hands-off.
Scalability: It helps manage environments with a large number of services, ensuring efficient and scalable monitoring.
Adaptability: Prometheus can quickly adapt to changes such as scaling up or down, which is essential for dynamic infrastructures like cloud environments.
What is Relabeling in Prometheus?
Relabeling in Prometheus allows users to modify or filter the labels associated with discovered targets before they are scraped or stored. This feature provides flexibility in transforming metadata to meet the monitoring and querying needs, making it easier to organize and manage metrics.
Types of Service Discovery in Prometheus
Prometheus supports multiple service discovery mechanisms. Some of the most common include:
File-based Service Discovery: A simple approach that uses static configuration files listing targets to be scraped.
Cloud Provider-based Discovery: Integrates directly with cloud platforms like AWS, GCP, and Azure to dynamically detect services running on virtual machines or containers.
File-based Service Discovery
File-based service discovery uses a file containing target configurations that Prometheus reads and scrapes for metrics. This method is simple and effective for environments where services are relatively static or changes are scripted.
- Create One Instance for Prometheus Server and other two instance for Targets (node-exporter).
Step-by-Step Guide for File-based Service Discovery
- Create a Target File: Create a JSON or YAML file listing the targets to be monitored on prometheus server instance.
vim ServiceDiscovery.yml
- targets: ["<target-node-ip>:9100"]
  labels:
    region: "ap-south-1"
    team: "Testing"
    platform: "AWS"
2. Configure Prometheus: Modify the prometheus.yml configuration file to include the file-based service discovery.
vim prometheus.yml
 - job_name: "ServiceDiscovery"
    file_sd_configs:
    - files:
      - ServiceDiscovery.yml
   relabel_configs:
    - source_labels: [team]
      regex: "Test.*"
      replacement: "Testing"
      target_label: team
3. Run Prometheus: Start or restart Prometheus to apply the new configuration.
./prometheus &
Prometheus will now read the target file at regular intervals and update its list of scrape targets accordingly.
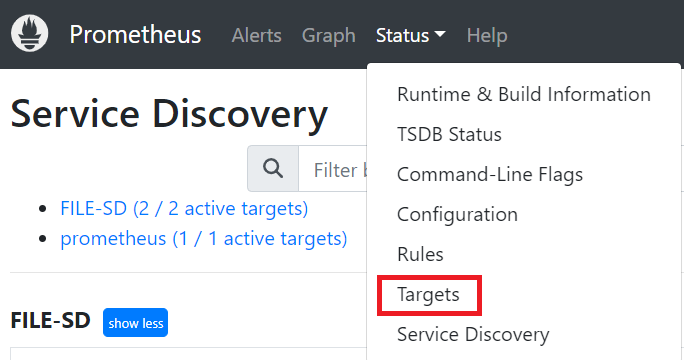
4. Verify Targets: Access the Prometheus web UI (http://public-ip:9090/targets) to verify that the targets are being discovered and scraped.


EC2 Service Discovery
EC2 service discovery is particularly useful for environments running on AWS. Prometheus can automatically discover EC2 instances using the AWS API, making it ideal for dynamic cloud environments where instances are frequently created and terminated.
We will use Other AWS account for this demo, not the one where prometheus is running.
- Configure Prometheus: Modify the
prometheus.ymlconfiguration file to include EC2 service discovery.
- job_name: "EC2-ServiceDiscovery"
    ec2_sd_configs:
      - access_key: <Your-Access-Key>
        secret_key: <Your-Secret-Key>
        region: us-east-2
2. Launch EC2 Instances: Ensure you have EC2 instances running with the appropriate tags (e.g., Name=node_exporter) and that they expose metrics (e.g., running Node Exporter on port 9100).


- For setting up node exporter, we will put below code in user-data.
#!/bin/bash
wget https://github.com/prometheus/node_exporter/releases/download/v1.8.2/node_exporter-1.8.2.linux-amd64.tar.gz
tar -xvzf node_exporter-1.8.2.linux-amd64.tar.gz
node_exporter-1.8.2.linux-amd64/node_exporter &

Launch Instance, the node exporter will automatically configured.
Verify at
http://public-ip:9100/metrics

3. Start Prometheus: Run Prometheus with the updated configuration.
./prometheus &
4. Verify Targets: Access the Prometheus web UI (http://<prometheus-server-ip>:9090/targets) to verify that the EC2 instances are being discovered and scraped.
- The configuration has been successfully done but the instance is still in
UNKNOWNstate.


This is because the Endpoint that it captures is the private IP of the exporter instance with 80 port number. But the actual endpoint is
http://public-ip:9100/metrics.So we need to do relabeling here.We will put the
__meta_ec2_public_ipin the__address__label instead of__meta_ec2_private_ip
relabel_configs:
      source_labels: [__meta_ec2_public_ip]
      regex: "(.*)"
      replacement: "${1}:9100"
      target_label: __address__

- To reload the prometheus process, we will use below command:
kill -HUP `pgrep prometheus`

- The changes have been made to prometheus after reloading and hence the state of the instance is
UP.

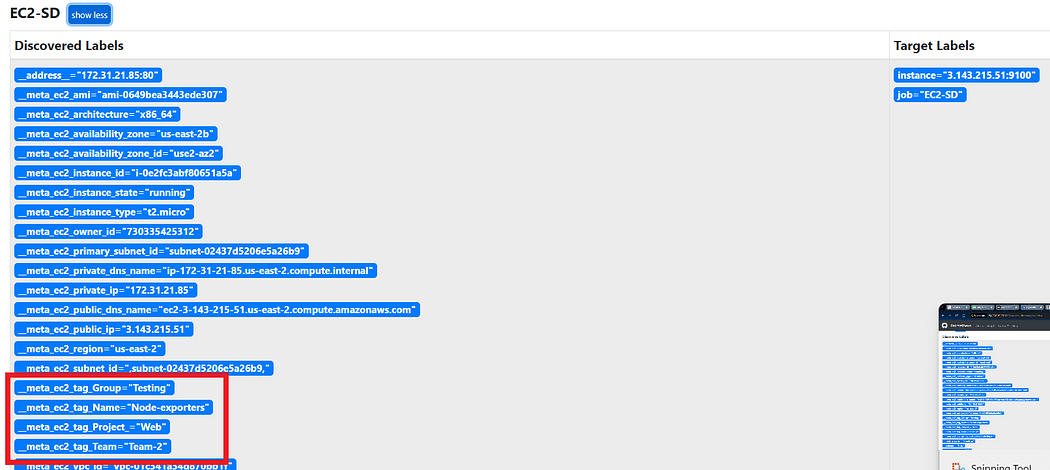
5. Giving labels to Dynamic Targets:
- For giving the labels to the targets, we first have to give the tags to the AWS ec2 instance while launching them.


Now we want to put these AWS ec2 tags to our target labels, so that it will align with desired quiring requirements.
Go to the
prometheus.ymland provide the relabel configs there.
 - source_labels: [__meta_ec2_tag_Group]
        regex: "(.*)"
        replacement: "Teting"
        target_label: Group
      - source_labels: [__meta_ec2_tag_Project]
        regex: "(.*)"
        replacement: "${1}"
        target_label: Project
      - source_labels: [__meta_ec2_tag_Team]
        regex: "(.*)"
        replacement: "${1}"
        target_label: Team
- Save the configuration file and reload the prometheus.


- Now we can quering all the instance with similar labels.
Integrating Prometheus with Grafana for Visualizing Metrics
Once Prometheus is set up and scraping metrics from your targets, the next step is to visualize this data using Grafana. Grafana provides powerful visualization tools, allowing you to create dashboards for monitoring your infrastructure.
Steps to Integrate Prometheus with Grafana
Install Grafana: First, install Grafana on your server. You can follow the installation guide on the official Grafana website.
Add Prometheus as a Data Source:
Open the Grafana dashboard (usually at http://<grafana-ip>:3000).
Go to Configuration > Data Sources.
Choose Prometheus from the list of available data sources.
Enter the URL of your Prometheus server (e.g., http://<prometheus-ip>:9090).
Click Save & Test to ensure Grafana can connect to Prometheus.
Create Dashboards: Now you can create dashboards in Grafana to visualize the metrics that Prometheus is collecting. Grafana has built-in support for Prometheus queries, so you can create visualizations like graphs, heatmaps, and tables based on the Prometheus data.
Explore Metrics:
- You can use the Explore feature in Grafana to query Prometheus metrics and create ad-hoc queries for deeper analysis.
Conclusion
Service discovery in Prometheus dramatically enhances monitoring in dynamic environments by automating the process of detecting and managing targets. Whether using file-based discovery for static setups or EC2 discovery for dynamic cloud environments, Prometheus simplifies monitoring configuration and ensures that your system scales efficiently.
By integrating Prometheus with Grafana, you gain powerful visualization capabilities, allowing you to create insightful dashboards that provide real-time visibility into your infrastructure’s performance. Together, these tools enable efficient, scalable, and automated monitoring, making it easier to manage complex, dynamic environments.